So, the subset function allows me to create an another data frame with samples with a value larger than, in this case 64.
> c7pos <- subset(c7, Nuc.647_Int >= 64)
> c7pospercent <- nrow(c7pos)/nrow(c7)*100
Then the calculation gives a value for this.
Looks OK.
Not quite sure I like the values but that's the way.
How do these percentages compare to the percentages for the wells?
I need to compare.
Time for bed: 22:11
Monday, 17 November 2014
Wednesday, 5 November 2014
Analysing Jim's Data again....
So I have a new lot of cellular data with new HA data in there.
Steps:
Steps:
- Turn into a CSV file in Excel
- Delete negative values from the Int column for each channel - about 7 values
- Create a new Project in R... AnalysingCellDataAgain20141105
- Open the script.. AllDensityPlots20141021.R
- Import data into R
- Import map of plate into R
- Create subset of the data to make life quicker and easier
- Create each individual sample in a separate data frame
- is this necessary?
- currently I have to change numbers in each to make it work. this can't be correct.
- Right now, I have just done the first 6.
- Graphed a few plots.
- Playing with ggplot scatter plots - still not got the right ones.
Going home now after an hour and a quarter.
Friday, 24 October 2014
Colours - color names...
The names of lots of colours or colors are listed here:
http://www.graphviz.org/doc/info/colors.html
ColorBrewer has a nice demo of them too:
http://colorbrewer2.org/
http://www.graphviz.org/doc/info/colors.html
ColorBrewer has a nice demo of them too:
http://colorbrewer2.org/
Geomapping from a UK post code...
Very useful resource although I have to do it individually.
http://websemantics.co.uk/online_tools/postcode_to_coordinates_conversion_tool/
http://websemantics.co.uk/online_tools/postcode_to_coordinates_conversion_tool/
Tuesday, 21 October 2014
Analysing cell data for Jim 20141021
Ok, so I have been developing some R-scripts to play with Jim’s cellular data.
The basic data is made up of 57,290 observations of 18 variables.
It is currently imported as a data.frame called “cells”.
I reduced the number of columns in the dataframe to those I believed are the key.
CODE:
#reduce the number of columns in the dataframe
#I have selected these as the Key variables
keyvar <- c('Section','Target','WC.area','WC.488_Int', 'WC.546_Int', 'Nuc.647_Int' )
# This command creates a dataframe that is a subset with fewer columns
subset <- cells[,keyvar]
This reduces the data to just six columns.
Next step is to split the data into individual treatments.
I did this using a map of the plate, prepared in Excel and saved as a csv file.
N.B. Need to be careful to have a space after “A - 1 “ - otherwise first sample includes “A - 10”, “A - 11” and “A - 12”
There should be a way to do this automatically for all of the conditions but I currently have to do some of this by hand.
Arghh - There has to be a loop or some kind of control structure to do this!!!
Next
I need to remove missing values from each of the data sets…
Then draw the density curves and plot them so that they can be output as a nice looking PDF.
Script Name: AllDensityPlots20141021.R
USING ggplot
So the next step is to do the dot plots.
I can get this to work well with the ppErk and the HA staining.
However, the EdU staining is more awkward and I am going to have to ask Jim how he did that.
Script Name: DotPlots20141021.R
Trying to do statistics....
I would like to do some statistics on Jim's data.
I think some kind of ANOVA or MANOVA is the right thing to do but I can't work out how to do it.
I can do the T-tests but that's all at the moment!
This site seems to have a very good ANOVA example:
http://ww2.coastal.edu/kingw/statistics/R-tutorials/repeated.html
There seems to be a requirement to change the format of the data significantly.
I think this can be done but I'm not exactly sure how at the moment.
Because Jim's values have different numbers of observations for each treatment it's not trivial.
I'm pretty sure the ANOVA will allow that but I'm not sure exactly how to assemble the data to make this work.
Monday, 20 October 2014
Dot plots using ggplot....
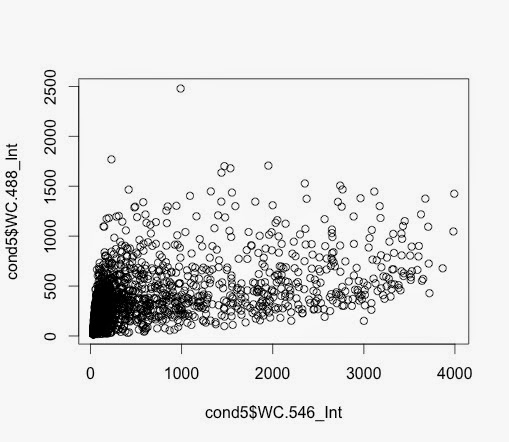
So I am plying with Jim's cellular data to try to understand and explore it a bit.
Condition 3 and Condition 5 plotted.
Q61 and V600 - no FBS and DUSPWT
> plot1 <- ggplot(cond5nomiss,
aes(x=WC.546_Int, y=WC.488_Int))
+ geom_point()
> plot1 + scale_y_log10() + scale_x_log10() + geom_density2d()


Condition 3 and Condition 5 plotted.
Q61 and V600 - no FBS and DUSPWT
> plot1 <- ggplot(cond5nomiss,
aes(x=WC.546_Int, y=WC.488_Int))
+ geom_point()
> plot1 + scale_y_log10() + scale_x_log10() + geom_density2d()
This generated this plot - which is V600:
and the equivalent from Q61:
Friday, 17 October 2014
2D density plots....
For 2D plots this seems important
https://stat.ethz.ch/R-manual/R-devel/library/MASS/html/kde2d.html
But I think a
contourplot from the lattice library is a good start.
https://stat.ethz.ch/R-manual/R-devel/library/MASS/html/kde2d.html
But I think a
contourplot from the lattice library is a good start.
missing values...
Code from here:
http://www.statmethods.net/input/missingdata.html
x <- c(1,2,NA,3)
mean(x) # returns NA
mean(x, na.rm=TRUE) # returns 2
Key points is the:
na.rm=TRUE
Useful!
http://www.statmethods.net/input/missingdata.html
x <- c(1,2,NA,3)
mean(x) # returns NA
mean(x, na.rm=TRUE) # returns 2
Key points is the:
na.rm=TRUE
Useful!
Thursday, 16 October 2014
First dot plot of cellular data...
2,330 data points.
Same dot plot for Ctl Virus:
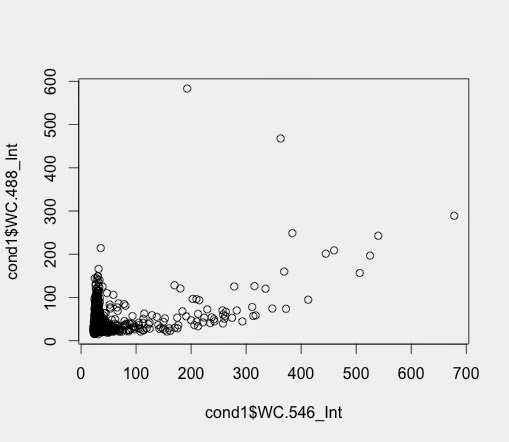
Important to NOTE: Axis are different!!
Nice looking overlays of density plots...
I was supposed to be looking into dot plots but I hit a problem and went back to density plots.
I worked out a nice way to generate overlays that have their own maximum and so look good together.
To do it I adapted useful code from here:
http://robjhyndman.com/hyndsight/r-graph-with-two-y-axes/
Using Jim's cellular data separated into samples previously. The basic graphs are generated with this code:
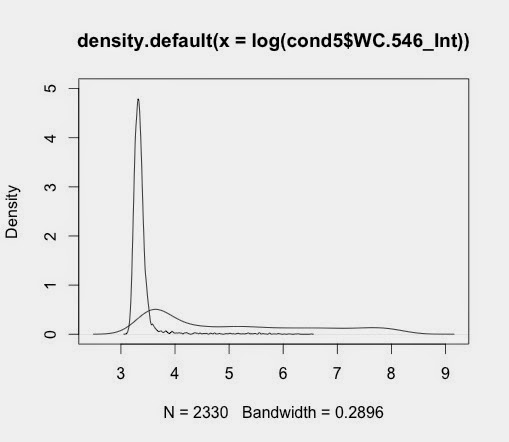
d5_546<-density(log(cond5$WC.546_Int))
d1_546<-density(log(cond1$WC.546_Int))
Plotting these give individual graphs
plot(d1_546)
plot(d5_546)
when saved gives output like this:


This gives this:

My first attempt at overlaying the plots:
par(mfrow=c(1,1))
plot(d5_546, ylim=c(0,5))
lines(d1_546)
To overlay these and turn them into nice graph
par(mar=c(5,4,4,5)+.1)
plot(d5_546,col="red", main=" ", xlab="", ylab=" ")
par(new=TRUE)
plot(d1_546,col="blue",xaxt="n",yaxt="n",xlab="",ylab="", main="HA staining")
axis(4)
mtext("Cell count-Ctrl Vir",side=4,line=3)
mtext("Cell count-V600",side=2,line=3 )
mtext("Whole Cell Intensity (546nm = HA)",side=1,line=3 )
legend("topright",col=c("red","blue"),lty=1,legend=c("V600","Ctl Vir"))

I worked out a nice way to generate overlays that have their own maximum and so look good together.
To do it I adapted useful code from here:
http://robjhyndman.com/hyndsight/r-graph-with-two-y-axes/
Using Jim's cellular data separated into samples previously. The basic graphs are generated with this code:
d5_546<-density(log(cond5$WC.546_Int))
d1_546<-density(log(cond1$WC.546_Int))
Plotting these give individual graphs
plot(d1_546)
plot(d5_546)
when saved gives output like this:
I can plot these two on the same page
par(mfrow=c(2,1))
plot(d1_546)
plot(d5_546)
This gives this:
My first attempt at overlaying the plots:
par(mfrow=c(1,1))
plot(d5_546, ylim=c(0,5))
lines(d1_546)
Not particularly useful because we lose the other sample.
To overlay these and turn them into nice graph
par(mar=c(5,4,4,5)+.1)
plot(d5_546,col="red", main=" ", xlab="", ylab=" ")
par(new=TRUE)
plot(d1_546,col="blue",xaxt="n",yaxt="n",xlab="",ylab="", main="HA staining")
axis(4)
mtext("Cell count-Ctrl Vir",side=4,line=3)
mtext("Cell count-V600",side=2,line=3 )
mtext("Whole Cell Intensity (546nm = HA)",side=1,line=3 )
legend("topright",col=c("red","blue"),lty=1,legend=c("V600","Ctl Vir"))
This works well to give the following graph:
Some useful links....
Overlaying density plots:
Two ways - one with normal graphics and the other with ggplot:
http://stackoverflow.com/questions/6939136/how-to-overlay-density-plots-in-r
R Tutorials:
A whole list of online free tutorials
http://ww2.coastal.edu/kingw/statistics/R-tutorials/
Running a loop in R:
The basics of a loop
http://www.dummies.com/how-to/content/how-to-loop-through-values-in-r.html
Appending rows to a dataframe:
rbind command from R-cookbook
https://www.inkling.com/read/r-cookbook-paul-teetor-1st/chapter-5/recipe-5-20
How to plot a subset of a data frame in R?
using the "with" command
http://stackoverflow.com/questions/8293547/how-to-plot-a-subset-of-a-data-frame-in-r
Missing data
http://www.statmethods.net/input/missingdata.html
Wednesday, 15 October 2014
Nice plots of multiple graphs...
I suspect the secret of proper batch analysis for Jim is to assemble the data into PDFs that can be shared and discussed.
This requires outputting multiple graphs on one page.
I managed to do this using info from here:
http://www.cookbook-r.com/Graphs/Multiple_graphs_on_one_page_(ggplot2)/
but I'm not very happy with the quality of the output.
ggplot creates some problems with multiple graphs that I don't understand yet.
Using PNG is did output one nice looking data. I don't seem to be able to upload the PNG format to the blog so here is a screen grab:
ggplot
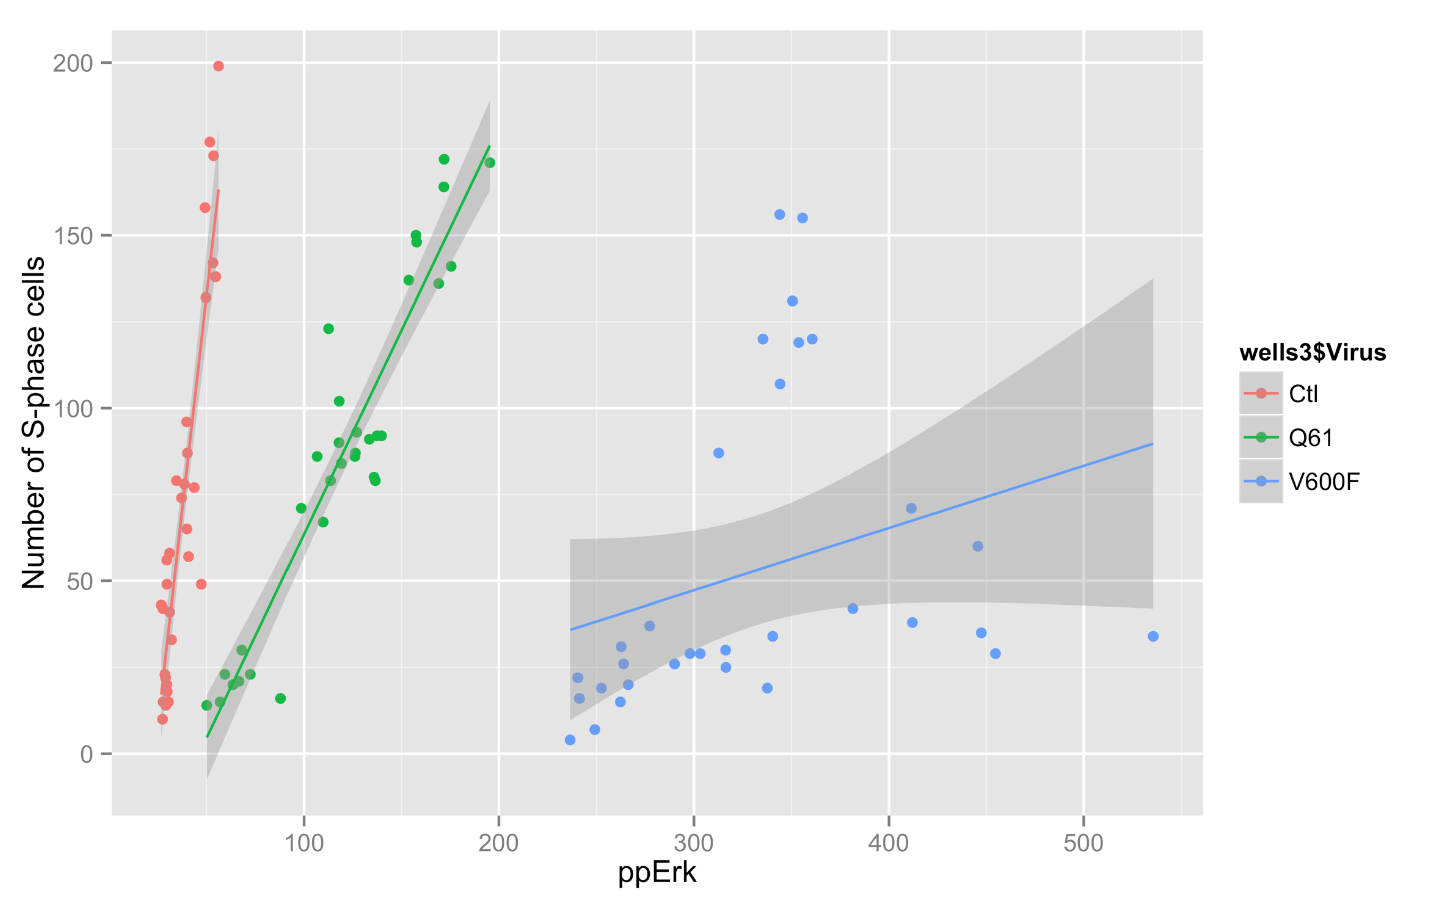
I have been using ggplot to generate some more graphs for Jim's data. It allows some very interesting graphs.
Code:
> qplot(ctlvirus$WC.488_Int, ctlvirus$S.phase_cells_Nuc_cnt, data=ctlvirus, geom=c("point", "smooth"),
method="lm", formula=y~x, color=ctlvirus$FBS,
main="Number of S-phase cells Vs pErk staining",
xlab="ppErk", ylab="Number of S-phase cells")
Graph:

Code:
> qplot(ctlvirus$WC.488_Int, ctlvirus$S.phase_cells_Nuc_cnt, data=ctlvirus, geom=c("point", "smooth"),
method="lm", formula=y~x, color=ctlvirus$FBS,
main="Number of S-phase cells Vs pErk staining",
xlab="ppErk", ylab="Number of S-phase cells")
Graph:
2D colour density plot (scatter plot)....
So for Jim Caunt's data, what I really want to do is to generate a 2D colour density plot.
To generate a 2D colour density plot, it requires three sets of values:
To generate a 2D colour density plot, it requires three sets of values:
- X-axis
- Y-axis
- Colour density data.
This is three columns in a data frame.
Some interesting advice here: https://www.biostars.org/p/73193/
As a by the way, I noticed another way to make a new data frame:
DF2 <- data.frame(wells4$WC.488_Int, wells4$WC.546_Int, wells4$S.phase_cells_Nuc_cnt)
This creates a data.frame with the columns from the other data frame.
Useful to know!
I don't really have my head around ggplot yet.
Arghh!
Some useful stuff here: http://www.statmethods.net/advgraphs/ggplot2.html
Tuesday, 14 October 2014
Deleted one value from Jim's data...
This is important to remember!!
I found a negative value which causes a lot of problems when we look at log of the plots.
There was only one so I deleted it!!!
Just a note so that I remember!!!!
I found a negative value which causes a lot of problems when we look at log of the plots.
There was only one so I deleted it!!!
Just a note so that I remember!!!!
Manipulating data frames....
I have learned a little from this post which is all about manipulating data frames:
http://www.r-bloggers.com/select-operations-on-r-data-frames/
It's a little complex but well worth understanding!
for adding columns and rows, it seems like cbind and rbind are the way to go.
However, it's important first to make your columns... they have to be the same size.
http://www.r-bloggers.com/select-operations-on-r-data-frames/
It's a little complex but well worth understanding!
for adding columns and rows, it seems like cbind and rbind are the way to go.
However, it's important first to make your columns... they have to be the same size.
Monday, 13 October 2014
Histograms and density plots...
This is important:
reminder about how to draw both of these with R.
http://www.statmethods.net/graphs/density.html
reminder about how to draw both of these with R.
http://www.statmethods.net/graphs/density.html
Thursday, 9 October 2014
Importing directly from xlsx
So it is possible to read directly into R from xlsx.
It's not trivial but it does seem possible:
See info here:
http://stackoverflow.com/questions/7049272/importing-xlsx-file-into-r
more here:
http://www.milanor.net/blog/?p=779
and here:
http://www.r-bloggers.com/importexport-data-to-and-from-xlsx-files/
It's not trivial but it does seem possible:
See info here:
http://stackoverflow.com/questions/7049272/importing-xlsx-file-into-r
more here:
http://www.milanor.net/blog/?p=779
and here:
http://www.r-bloggers.com/importexport-data-to-and-from-xlsx-files/
Monday, 6 October 2014
Simple graphs in R
This link: http://www.harding.edu/fmccown/r/ has some nice examples.
written by this guy: http://frankmccown.blogspot.co.uk/
However, for R for Biochemists, I think we really need some biochemical examples.
Ideally some:
written by this guy: http://frankmccown.blogspot.co.uk/
However, for R for Biochemists, I think we really need some biochemical examples.
Ideally some:
- Kd and Vmax
- Time courses of protein production
- Perhaps a simple protein assay
- Need some correlation with statistics
- Need some mean, standard deviation.
- Need some T-tests (one sided, paired), ANOVA
- Want to do the multiple graph thing - very useful for data exploration.
- Some grouping algorithms maybe?
- Talk about good quality graphs
- Publication quality.
Interesting piece about R here:
http://stackoverflow.com/questions/3750153/relationship-between-plotting-packages-in-r
gnuplot vs R
http://www.manning-sandbox.com/thread.jspa?threadID=35427
gnuplot is just for graphing!
R is so much more!
Perhaps too much?
Friday, 3 October 2014
Using R - the easy way...
R is an open source statistics package. It's very powerful with lots of statistical models that can be used, lots of great graphics that can be made and most usefully - it's free. If you're interested in numbers, data, statistics, graphs, visualisations - R is one of the best tools there is.
I've spend the last number of months learning how to use R and today I want to give a primer on how to use R to do some simple things. Most of these are things that other packages can do - like Google Documents (but you need internet access) or Excel (but you have to pay for it) but you have to start with the easy stuff.
Your first calculation
Step 1: Download R and unpack it.
Step 2: Download R-Studio and unpack it.
Step 3: Type the following simple text into R-studio:
>3+5
press return
you get:
[1] 8
You've just used R.
Your first graph
> x <- c(1,2,3,4)
> y <- c(2,4,6,8)
> plot(x,y)
>
Import a datafile
Customise a graph
Export a graph.
Using the top box.
Check out RStudio videos
Thursday, 2 October 2014
Making contour plots in R
I am wondering how to make contour plots in R because of a chat I had with Jim from Bath.
It looks very feasible and as usual there are many ways to do it.
Generally, a contour plot of this type has three different kinds of values:
It looks very feasible and as usual there are many ways to do it.
Generally, a contour plot of this type has three different kinds of values:
- a value for the X axis
- a value for the Y axis
- some kind of value for the colour.
Often the X and Y axis are continuous while the colour is a little more categorical although it can be quite continuous.
Searching, as you would, in Google gives some of the following sources:
https://stat.ethz.ch/R-manual/R-devel/library/graphics/html/contour.html
- some very interesting examples here.
https://stat.ethz.ch/R-manual/R-devel/library/graphics/html/filled.contour.html
http://stackoverflow.com/questions/15869969/adding-a-color-key-to-contour-plots-in-r
Wednesday, 24 September 2014
1D histogram from Flow data AGAIN
plot(ntl, "FL4-A", breaks=10000, xlim=c(0,100000))
this "breaks" makes a real difference!
this "breaks" makes a real difference!
Links for R flow packages and info re 1D histogram
http://www.bioconductor.org/packages/release/bioc/manuals/flowViz/man/flowViz.pdf
http://www.bioconductor.org/packages/release/bioc/vignettes/flowCore/inst/doc/HowTo-flowCore.pdf
Found a little about how to plot 1D histograms:
plot(ntl, c("FL4-A"), breaks=10000, xlim=c(0, 100000))
Plot needs some kind of log transformation for sure.
http://www.bioconductor.org/packages/release/bioc/vignettes/flowCore/inst/doc/HowTo-flowCore.pdf
Found a little about how to plot 1D histograms:
plot(ntl, c("FL4-A"), breaks=10000, xlim=c(0, 100000))
Plot needs some kind of log transformation for sure.
Playing with flow cytometry data in R....
So, I have been using Amy's flow data to try and grapple with data into R.
Making some progress!
I have managed to get some FCS data into R:
ntl<-read.FCS("A01 NTL.fcs")
plot(ntl, c("FSC-A", "SSC-A"), xlim=c(0, 5000000), ylim=c(0, 500000))
draws a nice dot plot:

Making some progress!
I have managed to get some FCS data into R:
ntl<-read.FCS("A01 NTL.fcs")
plot(ntl, c("FSC-A", "SSC-A"), xlim=c(0, 5000000), ylim=c(0, 500000))
draws a nice dot plot:
So there is a data format issue. We have:
- Formal class flowSet
- Large flowFrame
- Formal class workFlow
According to this: http://master.bioconductor.org/help/course-materials/2010/BioC2010/intro.pdf
flowFrame - a class representing the data contained in a FCS file.
1. raw measurement
2. keywords in the FCS files
3. annotation for parameters (stains, sample names, range)
flowSet - a collection of flowFrame.
So it is possible to do gating but I am finding it difficult to understand and make work.
Some info here but it's a bit challenging:
http://master.bioconductor.org/help/course-materials/2010/BioC2010/AnalyzingFlowData.pdf
Thursday, 11 September 2014
passing variables...
Passing them within functions.
https://www.daniweb.com/web-development/javascript-dhtml-ajax/threads/298104/passing-variables-from-one-function-to-another
http://stackoverflow.com/questions/10579713/passing-a-local-variable-from-one-function-to-another
http://javascript.about.com/od/3functions/a/fun06.htm
Learning how to make JSON....
So the key piece of code is JSON.stringify
This example shows it very simply:
from a comment on this page:
http://freshbrewedcode.com/jimcowart/2013/01/29/what-you-might-not-know-about-json-stringify/
This example shows it very simply:
var a = [];
a.push({ name: 'x1' });
a.push({ name: 'x2' });
console.log(JSON.stringify(a));
In the console log you get:
[{"name":"x1"},{"name":"x2"}]
from a comment on this page:
http://freshbrewedcode.com/jimcowart/2013/01/29/what-you-might-not-know-about-json-stringify/
So testing this:
var start = 21;
var a = [];
a.push({ name: start });
a.push({ name: 'x2' });
console.log(JSON.stringify(a));
In the console log you get:
[{"name":21},{"name":"x2"}]
GOOD!!!!
VERY STRANGELY, EVEN WHEN I SEND IT AS JSON, THE SCRIPT I HAVE WRITTEN DOESN'T SEEM TO LIKE IT.
I DON'T KNOW QUITE WHY!
Surprisingly, a variation on push seems to work:
var start = 21;
var end = 193;
var color = "blue";
var a =[];
a.push({ 'start': start, 'end': end, 'color': color });
This gives data that the molecule renderer seems to like.
Internet Explorer 8
So it seems that IE8 does not support SVG or responsive websites very well.
This is a bit disappointing as IE8 is on lots of Uni machines and lots of staff have IE8 on their browser.
It seems very likely that this was Michael Stechman's problem too!
However, with a bit of work this morning, I think I have found a way around this - IE8 specific code!
Some helpful links:
http://css-tricks.com/how-to-create-an-ie-only-stylesheet/
from which I copied the code:
<!--[if lte IE 8]> <link rel="stylesheet" type="text/css" href="ie8-and-down.css" /> <![endif]-->
A general terms for these are Conditional Comments - they seem to be an Internet Explorer specific thing.
http://www.quirksmode.org/css/condcom.html
It's not just limited to styles sheets, you can also use this code in the html to include pictures and other content.
There is also some additional code required because of bootstrap as well.
I copied these from the bootstrap website:
    <!-- HTML5 Shim and Respond.js IE8 support of HTML5 elements and media queries -->
    <!-- WARNING: Respond.js doesn't work if you view the page via file:// -->
    <!--[if lt IE 9]>
      <script src="https://oss.maxcdn.com/html5shiv/3.7.2/html5shiv.min.js"></script>
      <script src="https://oss.maxcdn.com/respond/1.4.2/respond.min.js"></script>
    <![endif]-->
This is all required because some of the Cardiff Uni computers still use IE8!!!
Let's hope my pages work on these now.
Wednesday, 10 September 2014
Extracting protein sequence
So I want to write a javascript that will extract a protein sequence.
Extracting from the straight XML webpage has some challenges because the source has multiple XML tags.
So I tried the DAS server which has been used before.
Link to the DAS server: http://www.ebi.ac.uk/uniprot-das
The DAS server has XML files for sequence and for features.
It will prove easier to extract data from I think.
Yes, this works better and I have written a script that will extract the sequence.
Success!!!
Finding out more about BioJS workflows...
Key aspects of the work flow include:
testing - mocha
http://visionmedia.github.io/mocha/
Some interesting stuff here:
http://blog.codeship.io/2014/01/22/testing-frontend-javascript-code-using-mocha-chai-and-sinon.html
GULP (what is this?)
testing - mocha
http://visionmedia.github.io/mocha/
Some interesting stuff here:
http://blog.codeship.io/2014/01/22/testing-frontend-javascript-code-using-mocha-chai-and-sinon.html
GULP (what is this?)
Tuesday, 9 September 2014
BioJS Edu....
So I made my first pull request on BioJS edu and it has been accepted.
I have been invited as part of the BioJS team so that's nice too.
I have spent most of the day trying to work out how to use the new BioJS 2.0 files in html pages.
Unfortunately, not with much success.
However, I have managed to get one to work at last!!
The file:
file:///Users/paulbrennan/Documents/Aptana%20Studio%203%20Workspace/biojs/index20140909.html
doesn't write any text to the screen but does write something to the console.
It loads up the script from
<script src="https://drone.io/github.com/greenify/biojs-io-fasta/files/build/biojs_io_fasta.min.js"></script>
and runs it in the script tag:
It pulls some code from in this way:
biojs.io.fasta.parse.read("http://dev.biojs-msa.org/v1/dummy/PF00072.fasta", function(seqs){ console.log(seqs); });
This is all fine as far as it goes but it's a bit artificial.
However, it does at least show that it works and that I can make it work in some naive format.
Full set of code:
<!DOCTYPE html>
<html lang="en">
<head>
<meta charset="utf-8">
<meta http-equiv="X-UA-Compatible" content="IE=edge">
<meta name="viewport" content="width=device-width, initial-scale=1">
<meta name="description" content="">
<meta name="author" content="Paul Brennan">
<link rel="icon" href="../../favicon.ico">
<title>Playing with BioJS 2...</title>
<!-- load up the scripts -->
<script src="https://drone.io/github.com/greenify/biojs-io-fasta/files/build/biojs_io_fasta.min.js"></script>
<script>
biojs.io.fasta.parse.read("http://dev.biojs-msa.org/v1/dummy/PF00072.fasta", function(seqs){ console.log(seqs); });
</script>
</head>
<body>
</body>
BioJS 101 tutorials
Headstart
So first thing is to write a very simple script with javascript.
This can then be run by node so long as you are in the correct folder.
Package basics
Important point:
So first thing is to write a very simple script with javascript.
This can then be run by node so long as you are in the correct folder.
Package basics
Important point:
For BioJS 2 components, we have following naming conventions:
biojs-[io/rest/vis/algo/…]-[name]
- Use
iofor components which are responsible for parsing data into a specific format (aka parser) - Use
visfor components which are visualizing data sets - Use
restfor REST apis to databases - Use
algofor server/client side algorithms processing the data (e.g. alignments, neural networks, markov models, graph algorithms)
require is a special function provided by node.js
package.json
this seems to contain the key information about the package.
npm
npm
stands for node packaged modules.
But what does it really mean?
According to Wikipedia:
npm (Node Packaged Modules) is the official package manager for Node.js.
stands for node packaged modules.
But what does it really mean?
According to Wikipedia:
npm (Node Packaged Modules) is the official package manager for Node.js.
Brew, git and node.js AND my first pull request...
So these are three packages that are worth having on your mac to do software development.
Homebrew, git and node.js are three packages that are worth having on your Mac if you want to do software development.
Homebrew is called the 'missing package manager for OS X'. It allows you to download packages onto your Mac from your command line.
Git is a version control system that will keep track of the changes you have made in code.
Node.js is an 'asynchronous event driven framework'.
So, I have made my first pull request to a tutorial.
I hope I have done it correctly and I am pretty happy about it so far!!
Using Git in Aptana
So, you need to choose the 'App Explorer' to find the Git settings in Aptana.
Once you do this, you find the 'Stage' and 'Commit' Buttons.
Once you do this, you find the 'Stage' and 'Commit' Buttons.
Monday, 8 September 2014
BioJS again...
Getting started from
http://edu.biojs.net/series/101/20_getting_started.html#mac
installing npm
What is this again?
Let's find out...
Wikipedia: http://en.wikipedia.org/wiki/Npm_(software)
npm stands for Node Packaged Modules
It's for downloading software onto your computer
Arghh trying to update the page too and find a way to make it work.
Fork into github.
Then trying to import this into Aptana.
Import...
Git repository as new project...
Use URI....
Using BioJS in your own webpage
Go to github:
https://github.com/biojs/biojs
This has the library of components.
Download these by pressing the "Download ZIP" button.
Then unzip the library.
No this is NOT the right place!
To actually down load the libraries, you need to go here:
https://github.com/biojs/biojs/releases
N.B. This is a large file that contains all the dependencies for BioJS.
These in themselves are very large files!!!!
59.6 MB
so it contains a lot.
Another option:
Point to somewhere that the library is.
myFavouriteProtein
So, I am trying to link BioJS with bootstrap and write a tutorial that allows this.
I can successfully, put in the sequence module.
The ProteinPortafolio module gives structure but not the proper information.
Let's spend some time trouble shooting that.
Ok, so I tried to simplify.
Get rid of all the bootstrap stuff in case there was some kind of CSS conflicts.
Sadly, still no text.
Also, I think there is an error in the documentation which I have circumvented by including the
Biojs.Tooltip.js script.
I am not sure why this work but without this script there is no structure.
Let's try just the 3D structure file.
Simplify!
Arghhh!
The only BioJS that I can really get to work is the Sequence module.
Why is this?
Need to try again from a different direction.
Friday, 29 August 2014
Problems with Github...
With all the local dependencies, the box of files is very large.
I shouldn't really have to send all of these to Git but I don't know how to keep it separate. In retrospect I probably shouldn't have committed them since I don't change them!
Can I uncommit?
I tried and ended up deleting everything.
ARGGHHH!!!
I shouldn't really have to send all of these to Git but I don't know how to keep it separate. In retrospect I probably shouldn't have committed them since I don't change them!
Can I uncommit?
I tried and ended up deleting everything.
ARGGHHH!!!
myFavouriteProtein...
So it's been an interesting day.
I have made contact with the BioJS people and I think that's a good start.
I think I can probably write a BioJS tutorial about how to interface BioJS and bootstrap.
I can certainly contribute that.
Some key points:
I probably need to simplify it a bit and work out how to make the components plug together a bit better.
The index2.html page has some issues.
ProteinPortafolio is not displaying the text information that it should. Don't know why!
I also can't get the Biojs.Protein3DUniprot component to work.
myFavourite Protein - two module displayed.
So good news is that I can display two BioJS modules on the same page.
It works if you code in the same script.
Some problems:
The Biojs.ProteinPortafolio script seems to return 3D structures for reasons I don't understand and I don't think should be my fault.
This needs checking!
Limitations:
Sequence module is hard coded!
The two bits are showing different proteins - NOT GOOD!
OK so I have improved it now.
Two modules displayed.
Both displaying NF-kappaB and both searching the Uniprot ID.
Good!
myFavouriteProtein page - back to the tutorial!
I have to look back at my previous notes with this...
Tracking my work on myFavouriteProtein page - try sequence component....
I couldn't get the ProteinPortfolio to work first time so I am going to try the Sequence component.
It requires some different scripts:
So I have made this work:

It requires some different scripts:
<script language="JavaScript" type="text/javascript" src="src/Biojs.Tooltip.js"></script>
So I have made this work:
Let's try DasProteinFeatureViewer
Obviously it requires different scripts and style sheets:
Mmm, I think it also requires me to make Biojs.FeatureViewer work too.
Mmm, more error messages and some frustration.
Also the second script seems to force out the stuff from the first script for reasons I don't understand.
Tracking my work on myFavouriteProtein - a webpage to use BioJS components Part 2 - getting all the other required stuff...
Checking out the websites, I need to gather the following dependencies...
Protein Portfolio
https://www.ebi.ac.uk/Tools/biojs/registry/Biojs.ProteinPortafolio.html
Clicking on Installation Tab:
Probably the easiest thing is just to download all of the Biojs scripts and put them in a folder.
Where do I get these from?
Github, of course. But where exactly?
To get something secure and stable, it's probably best to go to the release page on Github:
https://github.com/biojs/biojs/releases

Protein Portfolio
https://www.ebi.ac.uk/Tools/biojs/registry/Biojs.ProteinPortafolio.html
Clicking on Installation Tab:
Biojs scripts
1
2
3
4
5
6
| <script language="JavaScript" type="text/javascript" src="src/Biojs.js"><script language="JavaScript" type="text/javascript" src="../biojs/Biojs.PDBLogos.js"></script><script language="JavaScript" type="text/javascript" src="../biojs/Biojs.Sequence.js"></script><script language="JavaScript" type="text/javascript" src="../biojs/Biojs.Protein3D.js"></script><script language="JavaScript" type="text/javascript" src="../biojs/Biojs.Protein3DWS.js"></script><script language="JavaScript" type="text/javascript" src="src/Biojs.ProteinPortafolio.js"></script> |
External script(s)
1
2
3
| <script language="JavaScript" type="text/javascript" src="../biojs/dependencies/jquery/jquery-1.6.4.js"><script language="JavaScript" type="text/javascript" src="../biojs/dependencies/graphics/raphael-2.1.0.js"></script><script language="JavaScript" type="text/javascript" src="../biojs/dependencies/jmol-12.0.48/Jmol.js"></script> |
CSS stylesheet(s)
1
2
| <link href="../biojs/css/biojs.Protein3D.css" rel="stylesheet" type="text/css" /><link href="../biojs/css/biojs.ProteinPortafolio.css" rel="stylesheet" type="text/css"> |
Where do I get these from?
Github, of course. But where exactly?
To get something secure and stable, it's probably best to go to the release page on Github:
https://github.com/biojs/biojs/releases
Press the source code button to download the zip file.
Then open it on your computer.
Sadly this doesn't have everything or maybe it does. I down loaded other stuff too so I'm a bit confused.
Let's assume, this did download everything. I will check again on a different computer to ensure.
I am going to create a separate biojs folder in my dist folder.
In my biojs folder, I am creating a css and a js folder.
Then I am going to put all the necessary bits in there.
I didn't need to create the folders. Just copy them in paste them into the Aptana folder structure.
Copy dependencies folder into the dist.
Copy the js folder into biojs.
I think everything is there.
Some testing required to be sure.
First, have a look.
Yes, everything seems to be in place although slightly differently organised.
Let's cut and paste in the code and organise the files and that will be a good start.
I added the code in a script box and tried to get it to work but it hasn't.
Error messages include:
"
Consider using 'dppx' units, as in CSS 'dpi' means dots-per-CSS-inch, not dots-per-physical-inch, so does not correspond to the actual 'dpi' of a screen. In media query expression: (-webkit-min-device-pixel-ratio: 1.5), (min-resolution: 144dpi) tweet_button.1409007440.html:1
Requesting features for 'P99999' Biojs.js:181
Failed to load resource: net::ERR_FILE_NOT_FOUND file:///Users/paulbrennan/Documents/Aptana%20Studio%203%20Workspace/biojs/d…%2Fdas-srv%2Funiprot%2Fdas%2Funiprot-summary%2Ffeatures%3Fsegment%3DP99999
Error requesting features for P99999 Biojs.js:181
SUCCESS: data received Biojs.js:181
_createOptions: <option value="3NWV.D (2..105)">3NWV.D (2..105)</option><option value="3ZOO.D (2..105)">3ZOO.D (2..105)</option><option value="3ZOO.A (2..105)">3ZOO.A (2..105)</option><option value="3NWV.A (2..105)">3NWV.A (2..105)</option><option value="3NWV.B (2..105)">3NWV.B (2..105)</option><option value="3NWV.C (2..105)">3NWV.C (2..105)</option><option value="3ZCF.D (2..105)">3ZCF.D (2..105)</option><option value="3ZOO.C (2..105)">3ZOO.C (2..105)</option><option value="3ZCF.A (2..105)">3ZCF.A (2..105)</option><option value="3ZCF.B (2..105)">3ZCF.B (2..105)</option><option value="3ZCF.C (2..105)">3ZCF.C (2..105)</option><option value="1J3S.A (2..105)">1J3S.A (2..105)</option><option value="3ZOO.B (2..105)">3ZOO.B (2..105)</option> Biojs.js:181
Alignments for pdb 3NWV.D Biojs.js:181
Object Biojs.js:181
Current alignment Biojs.js:181
Object Biojs.js:181
Uncaught TypeError: undefined is not a function Biojs.ProteinPortafolio.js:294"
UGGHH!
Subscribe to:
Posts (Atom)