I suspect the secret of proper batch analysis for Jim is to assemble the data into PDFs that can be shared and discussed.
This requires outputting multiple graphs on one page.
I managed to do this using info from here:
http://www.cookbook-r.com/Graphs/Multiple_graphs_on_one_page_(ggplot2)/
but I'm not very happy with the quality of the output.
ggplot creates some problems with multiple graphs that I don't understand yet.
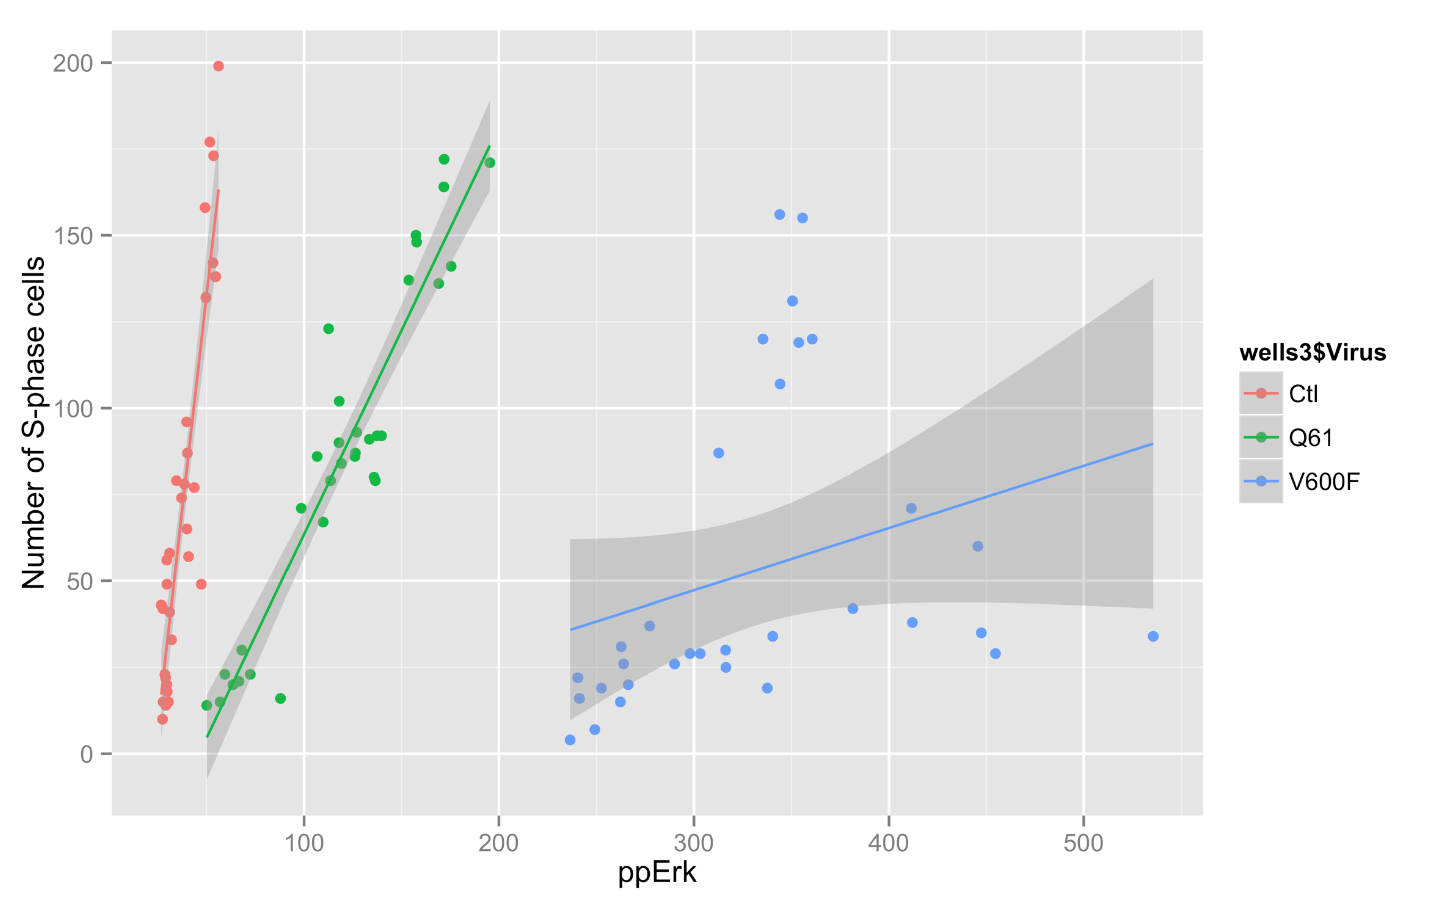
Using PNG is did output one nice looking data. I don't seem to be able to upload the PNG format to the blog so here is a screen grab:

No comments:
Post a Comment