Friday 31 January 2014

My first R generated word cloud


This prompts a few questions.
Firstly, what do the colours and sizes mean from a quantitative and statistical point of view?
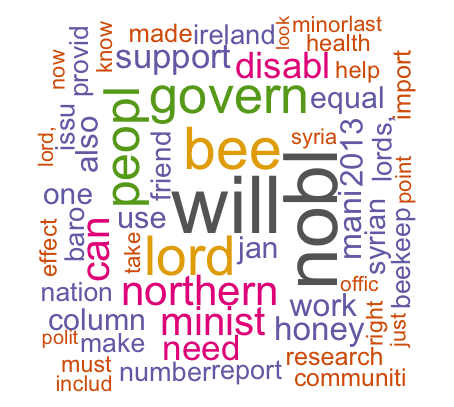
Secondly, is it wise to eliminate some words like "will".
We have some funny words that have "e" and "es" taken off the end. For example "includ" and "communiti". This is a bit odd.

I probably need to understand more of the nuts and bolts of the code and what it really represents.

Interesting, though.

Text mining and making a wordcloud...

As my first experiment with R in terms of doing anything useful, I want to make a word cloud.

I found a page which helps - HERE.

I need to install various packages including 'tm' and 'wordcloud'.

I should probably read this reference:  Introduction to the tm (text mining) Package.

I had to work out an error message:

  • "input string 33 is invalid UTF-8"
I did this by going back to Word and saving the file as UTF-8. 

This is important - text must be in UTF-8 format!

It does seem to have worked but it's quite slow and the word "and" had come up a lot which doesn't seem quite right. 

It also seems to have kind of crashed which is annoying!


Wednesday 29 January 2014

Create a vector in R


The easiest way to create a vector is with the `c()` function, which stands for "concatenate" or "combine". To create a vector containing
| the numbers 1.1, 9, and 3.14, type `c(1.1, 9, 3.14)`. Try it now and
| store the result in a variable called `z`.

R-studio, swirl and a few more commands...

So it looks as if R-studio does help a bit.
Swirl is a program to help people learn statistics and R at the same time.

To install a package like Swirl:
> install.packages("swirl")

To load a package like Swirl:
> library("swirl")

To run a package like Swirl:
> swirl()

Tuesday 28 January 2014

Simple R commands...

getwd() = gets the working directory
setwd("/Users/paulbrennan/Documents") = sets Documents in paulbrennan as the working directory.

read.csv("filename") = read a csv file.


An interesting R blog: http://onertipaday.blogspot.co.uk/

Getting good quality data that is worth visualising...

I need to learn how to scrape data.
Scraping from PDFs would seem like a good start.
A good search found this tutorial on scraping data from PDFs.

My first scrape from PDFs using scaperwiki didn't work as well as just cut and pasting into Word.

Interesting free book on D3.js

The website about D3.js is here.
There are lots of online tutorials.
A free book entitled "Interactive Data Visualization for the Web".

Tools for generating high quality visualisations

So there is:

  • Excel
  • Google Documents
  • R
  • Protovis
  • D3.js
  • Illustrator for polishing
  • Flash
The question is what should I use?

Monday 27 January 2014

Finding interesting data...

The Health in Wales website has a statistics and data section.
This mostly directs to the wales.gov.uk which really has a lot of data about Wales too. One interesting section is this one with Health-Statistics.
What I am really looking for is mortality statistics which is a bit of a challenge.
However, there is plenty of data in this Health Statistics section.