Wednesday, 16 December 2015
List of files from a github repository....
http://stackoverflow.com/questions/25485216/how-to-get-list-files-from-a-github-repository-folder-using-r
Tuesday, 8 December 2015
Thursday, 12 November 2015
Visualisation of proteomics data using R and Bioconductor
https://www.bioconductor.org/packages/release/data/experiment/vignettes/RforProteomics/inst/doc/RProtVis.html
Tuesday, 10 November 2015
Looking up Uniprot resources in Bioconductor
https://bioconductor.org/packages/release/bioc/html/UniProt.ws.html
see also:
http://mygene.info/mygene-included-in-bioconductor-3-0-release/
This is also an interesting resource:
https://www.bioconductor.org/packages/release/data/experiment/vignettes/RforProteomics/inst/doc/RProtVis.html
see also:
http://mygene.info/mygene-included-in-bioconductor-3-0-release/
This is also an interesting resource:
https://www.bioconductor.org/packages/release/data/experiment/vignettes/RforProteomics/inst/doc/RProtVis.html
Learned more from W3
For information and advice about coding, W3 is a great resource.
I just improved my blog using the information about formatting tables:
http://www.w3schools.com/html/html_tables.asp
I just improved my blog using the information about formatting tables:
http://www.w3schools.com/html/html_tables.asp
Tuesday, 27 October 2015
Converting PDF to text...
I want to try scraping some data from PDF reports....
The recommendation seems to be to use pdftotext.
This pages tells me how to install:
The recommendation seems to be to use pdftotext.
This pages tells me how to install:
- http://superuser.com/questions/286961/pdf-to-text-convertor
It's UNIX command line stuff....
brew install xpdf
or I could have tried:
brew install poppler
I don't know yet if there is a difference...
I followed the first one and put in the command
pdftotext your_pdf_file.pdf
and it's fast on the document, I used....
It works but for a small number of documents (say 10), it's nearly easier just to download each document, copy and paste....
Tuesday, 20 October 2015
manipulating csv files...
A colleague used Unix to manipulate a csv file.
It was very large so importing it into R or opening in Excel would have causes some problems.
the command used was
It was very large so importing it into R or opening in Excel would have causes some problems.
the command used was
perl was also used directly from the unix prompt to remove everything starting with a hash tag #
Useful addition to the data munging world!
Wednesday, 30 September 2015
Principal Component Analysis and other tools...
http://stats.stackexchange.com/questions/65692/how-to-visualize-what-canonical-correlation-analysis-does-in-comparison-to-what/65817#65817
http://stats.stackexchange.com/questions/95038/how-does-factor-analysis-explain-the-covariance-while-pca-explains-the-variance/95106#95106
http://stats.stackexchange.com/questions/94048/pca-and-exploratory-factor-analysis-on-the-same-data-set/94104#94104
http://stats.stackexchange.com/questions/95038/how-does-factor-analysis-explain-the-covariance-while-pca-explains-the-variance/95106#95106
http://stats.stackexchange.com/questions/94048/pca-and-exploratory-factor-analysis-on-the-same-data-set/94104#94104
Tuesday, 15 September 2015
Time to update R...
When you get one of these:
Warning message:
package ‘dplyr’ was built under R version 3.1.2
it's probably time to check the version of R, your using and probably time to update it too!
Type
> version
into the Console of R-studio and it will tell you what version you have currently..
I just updated R and got this response:
platform x86_64-apple-darwin13.4.0
arch x86_64
os darwin13.4.0
system x86_64, darwin13.4.0
status
major 3
minor 2.2
year 2015
month 08
day 14
svn rev 69053
language R
version.string R version 3.2.2 (2015-08-14)
nickname Fire Safety
Selection of useful links
Get R not to use scientific notation:
http://stackoverflow.com/questions/9397664/force-r-not-to-use-exponential-notation-e-g-e10
Links about quantile normalisation:
http://bmbolstad.com/stuff/qnorm.pdf
http://davetang.org/muse/2014/07/07/quantile-normalisation-in-r/
Piping in R:
https://cran.r-project.org/web/packages/magrittr/vignettes/magrittr.html
https://martinsbioblogg.wordpress.com/2014/03/27/more-fun-with-and/
http://www.r-statistics.com/2014/08/simpler-r-coding-with-pipes-the-present-and-future-of-the-magrittr-package/
Link for the data.table package:
https://cran.r-project.org/web/packages/data.table/index.html
ggvis:
http://blog.rstudio.org/2014/06/23/introducing-ggvis/
Open Data Wales Slack Channel
https://opendatawales.slack.com/messages/general/
Using ggplot to make graphs like Gapminder:
http://www.stat.ubc.ca/~jenny/STAT545A/block17_colorsGgplot2Qualitative.html
SciberMonkey from Biochem Soc
http://www.scibermonkey.org/
Blog about machine learning
http://machinelearningmastery.com/machine-learning-for-programmers/
Wednesday, 26 August 2015
Forcing new data into ggplot
http://stackoverflow.com/questions/9642360/ggplot2-use-to-plot-new-data
Monday, 3 August 2015
Resolving git conflicts...
I'm trying to sync my Electives Map from my home computer to my work computer.
However, this has identified a conflict.
I need to raise my game and work out what to do with conflicts in Github.
I'm currently working in the terminal using command prompt.
Here are the results when I typed git status and then git pull.
m095:AptanaElectives2014 paulbrennan$ git status
# On branch master
# Your branch is ahead of 'origin/master' by 1 commit.
# (use "git push" to publish your local commits)
#
# Untracked files:
# (use "git add <file>..." to include in what will be committed)
#
# data/barplot_low_20140827
# pictures/lowpoints20140827.png
nothing added to commit but untracked files present (use "git add" to track)
m095:AptanaElectives2014 paulbrennan$ git pull
remote: Counting objects: 45, done.
remote: Total 45 (delta 21), reused 21 (delta 21), pack-reused 24
Unpacking objects: 100% (45/45), done.
From https://github.com/brennanpincardiff/Electives2014
638c11b..3e7d41f master -> origin/master
Auto-merging futureops.html
CONFLICT (content): Merge conflict in futureops.html
Automatic merge failed; fix conflicts and then commit the result.
There is a conflict in the futureops.html file. If I go to the file then there the conflict is marked with this kind of text:
To fix the conflicts, make the necessary changes. Then add and commit the new file using the commands below.
git add filename
git commit -m "fixed conflict"
Let's check if everything looks OK:
git status
# On branch master
# Your branch is ahead of 'origin/master' by 2 commits.
# (use "git push" to publish your local commits)
#
nothing to commit, working directory clean
Need to push these to the external repository.
git push
Check status again:
m095:AptanaElectives2014 paulbrennan$ git status
# On branch master
nothing to commit, working directory clean
All done!
Ready to code again.
However, this has identified a conflict.
I need to raise my game and work out what to do with conflicts in Github.
I'm currently working in the terminal using command prompt.
Here are the results when I typed git status and then git pull.
m095:AptanaElectives2014 paulbrennan$ git status
# On branch master
# Your branch is ahead of 'origin/master' by 1 commit.
# (use "git push" to publish your local commits)
#
# Untracked files:
# (use "git add <file>..." to include in what will be committed)
#
# data/barplot_low_20140827
# pictures/lowpoints20140827.png
nothing added to commit but untracked files present (use "git add" to track)
m095:AptanaElectives2014 paulbrennan$ git pull
remote: Counting objects: 45, done.
remote: Total 45 (delta 21), reused 21 (delta 21), pack-reused 24
Unpacking objects: 100% (45/45), done.
From https://github.com/brennanpincardiff/Electives2014
638c11b..3e7d41f master -> origin/master
Auto-merging futureops.html
CONFLICT (content): Merge conflict in futureops.html
Automatic merge failed; fix conflicts and then commit the result.
There is a conflict in the futureops.html file. If I go to the file then there the conflict is marked with this kind of text:
<<<<<<< HEAD
CONFLICT
>>>>>>> upstream/unmergeable-branch
To fix the conflicts, make the necessary changes. Then add and commit the new file using the commands below.
git add filename
git commit -m "fixed conflict"
Let's check if everything looks OK:
git status
# On branch master
# Your branch is ahead of 'origin/master' by 2 commits.
# (use "git push" to publish your local commits)
#
nothing to commit, working directory clean
Need to push these to the external repository.
git push
Check status again:
m095:AptanaElectives2014 paulbrennan$ git status
# On branch master
nothing to commit, working directory clean
All done!
Ready to code again.
Tuesday, 28 July 2015
Draw a word cloud from the abstracts...
This bit of R script seems to work:
# make a word cloud of these abstracts
install.packages("tm")
install.packages("wordcloud")
library("tm")
library("wordcloud")
# combine the abs object into one string of words using the paste() function
# I've done this with a loop but I'm sure I could do it with an apply function
for (i in 1:length(abs)){
abs.1 <- paste(abs.1, abs[i])
}
wordcloud(abs.1,
max.words=100,
random.order=FALSE,
rot.per=0.35,
use.r.layout=FALSE,
colors=brewer.pal(8, "Dark2"))
Here is the output:
 It's pretty much what I expect so that's good news.
There are some words that could be removed but generally it's a good start, I think.
This method could be applied to a larger data set, I think.
IMPORTANTLY there are warnings. Some words not added because they 'won't fit on the page'. Need to be careful here.
I think it will be worthwhile to look at the frequency of the words.
# make a word cloud of these abstracts
install.packages("tm")
install.packages("wordcloud")
library("tm")
library("wordcloud")
# combine the abs object into one string of words using the paste() function
# I've done this with a loop but I'm sure I could do it with an apply function
for (i in 1:length(abs)){
abs.1 <- paste(abs.1, abs[i])
}
wordcloud(abs.1,
max.words=100,
random.order=FALSE,
rot.per=0.35,
use.r.layout=FALSE,
colors=brewer.pal(8, "Dark2"))
Here is the output:

There are some words that could be removed but generally it's a good start, I think.
This method could be applied to a larger data set, I think.
IMPORTANTLY there are warnings. Some words not added because they 'won't fit on the page'. Need to be careful here.
I think it will be worthwhile to look at the frequency of the words.
Thursday, 16 July 2015
download abstracts
I am using the package 'RISmed'.
Key steps:
Here is the code to find Pubmed IDs for publications by C. Pepper over the last five years:
res <- EUtilsSummary("Pepper_C[au]", type='esearch', db='pubmed', mindate=2010, maxdate=2015)
This creates the object res which is a list of Pubmed IDs.
It called a "Formal class EUtilsSummary".
To find out a bit more about the object the following commands are useful:
> str(res)
Formal class 'EUtilsSummary' [package "RISmed"] with 6 slots
..@ db : chr "pubmed"
..@ count : num 77
..@ retmax : num 77
..@ retstart : num 0
..@ PMID : chr [1:77] "25921075" "25897547" "25806611" "25752197" ...
..@ querytranslation: chr "Pepper_C[au] AND 2010[EDAT] : 2015[EDAT]"
> mode(res)
[1] "S4"
> summary(res)
Query:
Pepper_C[au] AND 2010[EDAT] : 2015[EDAT]
Result count: 77
>
So usefully this tells us about the search we have done and the number of results. The results are in the @PMID part of the object. The object is of class S4.
You can extract the individual PMIDs like this:
> res@PMID[1]
[1] "25921075"
> res@PMID[2]
[1] "25897547"
> res@PMID[3]
[1] "25806611"
Useful!!!
This res object can be used to download the abstracts using the EUtilsGet() function.
fetch <- EUtilsGet(res)
This returns an object called fetch.
This is called "Large Medline (618.6 Kb)"
It contains lots of data including the abstracts.
abs <- AbstractText(fetch)
Now we have 77 abstracts in a vector (I think).
> str(abs)
chr [1:77] "OBJECTIVES: Ganglioneuroblastomas represent a histological subgroup of the rare neuroblastic tumours with intermediate malignan"| __truncated__ ...
> mode(abs)
[1] "character"
> abs[1]
[1] "OBJECTIVES: Ganglioneuroblastomas represent a histological subgroup of the rare neuroblastic tumours with intermediate malignant potential arising from neural crest progenitor cells of sympathetic nerves. Diagnosis can often be difficult based on imaging alone. We describe 4 cases of children presenting with a solitary neck mass with histology ultimately revealing ganglioneuroblastoma.METHODS: A retrospective case note review was carried out of all patients with cervical ganglioneuroblastoma seen at Great Ormond Street Hospital, UK.RESULTS: Mean age at presentation was 5 years. Based on imaging, the initial diagnoses for three of the cases were: lymphatic malformation, carotid body tumour, paraganglioma, respectively, whilst the remaining case had an immediate incisional biopsy revealing the correct diagnosis. All cases were managed by surgical excision with no evidence of recurrence after a median follow up of 6 years.CONCLUSION: Otolaryngologists should be aware of ganglioneuroblastoma when establishing the differential diagnosis of a child presenting with a neck mass. Biopsy is recommended as the gold standard investigation to avoid an incorrect diagnosis."
>
Great. Good so far....
Key steps:
Get the Pubmed IDs.
This requires the function EUtilsSummary().Here is the code to find Pubmed IDs for publications by C. Pepper over the last five years:
res <- EUtilsSummary("Pepper_C[au]", type='esearch', db='pubmed', mindate=2010, maxdate=2015)
This creates the object res which is a list of Pubmed IDs.
It called a "Formal class EUtilsSummary".
To find out a bit more about the object the following commands are useful:
> str(res)
Formal class 'EUtilsSummary' [package "RISmed"] with 6 slots
..@ db : chr "pubmed"
..@ count : num 77
..@ retmax : num 77
..@ retstart : num 0
..@ PMID : chr [1:77] "25921075" "25897547" "25806611" "25752197" ...
..@ querytranslation: chr "Pepper_C[au] AND 2010[EDAT] : 2015[EDAT]"
> mode(res)
[1] "S4"
> summary(res)
Query:
Pepper_C[au] AND 2010[EDAT] : 2015[EDAT]
Result count: 77
>
So usefully this tells us about the search we have done and the number of results. The results are in the @PMID part of the object. The object is of class S4.
You can extract the individual PMIDs like this:
> res@PMID[1]
[1] "25921075"
> res@PMID[2]
[1] "25897547"
> res@PMID[3]
[1] "25806611"
Useful!!!
Downloading the abstracts
This res object can be used to download the abstracts using the EUtilsGet() function.
fetch <- EUtilsGet(res)
This returns an object called fetch.
This is called "Large Medline (618.6 Kb)"
It contains lots of data including the abstracts.
Extracting the abstracts
The abstracts can be extracted with the function AbstractText().abs <- AbstractText(fetch)
Now we have 77 abstracts in a vector (I think).
> str(abs)
chr [1:77] "OBJECTIVES: Ganglioneuroblastomas represent a histological subgroup of the rare neuroblastic tumours with intermediate malignan"| __truncated__ ...
> mode(abs)
[1] "character"
> abs[1]
[1] "OBJECTIVES: Ganglioneuroblastomas represent a histological subgroup of the rare neuroblastic tumours with intermediate malignant potential arising from neural crest progenitor cells of sympathetic nerves. Diagnosis can often be difficult based on imaging alone. We describe 4 cases of children presenting with a solitary neck mass with histology ultimately revealing ganglioneuroblastoma.METHODS: A retrospective case note review was carried out of all patients with cervical ganglioneuroblastoma seen at Great Ormond Street Hospital, UK.RESULTS: Mean age at presentation was 5 years. Based on imaging, the initial diagnoses for three of the cases were: lymphatic malformation, carotid body tumour, paraganglioma, respectively, whilst the remaining case had an immediate incisional biopsy revealing the correct diagnosis. All cases were managed by surgical excision with no evidence of recurrence after a median follow up of 6 years.CONCLUSION: Otolaryngologists should be aware of ganglioneuroblastoma when establishing the differential diagnosis of a child presenting with a neck mass. Biopsy is recommended as the gold standard investigation to avoid an incorrect diagnosis."
>
Great. Good so far....
plotting the number of citations....
Here's what I did to find the number of papers published about chronic lymphocytic leukeamia.
# do search in pubmed on the web
# pubmed - "chronic lymphocytic leukaemia" or "chronic lymphocytic leukemia" or "CLL"
# get an option to download a csv file
The csv file needs to have the top line removed. I did this by opening in Excel and saving it again.
setwd("/Users/paulbrennan/Dropbox/R for Biochemists/PubMed")
data <- read.csv("timeline2.csv")
sum(data[2])
# 17,517 publications
library(ggplot2)
# draw a graph
ggplot(data, aes(year, count)) +
geom_line() +
ylab("Publications") + # y-label
xlab("Year") + # x-label
theme_bw()
Here is the output:

Wednesday, 15 July 2015
Using R to get abstracts from Pubmed...
This package called pubmed.mine looks interesting:
http://cran.r-project.org/web/packages/pubmed.mineR/pubmed.mineR.pdf
So does this package RISmed:
http://cran.r-project.org/web/packages/RISmed/RISmed.pdf
There is a script here:
http://davetang.org/muse/2013/10/31/querying-pubmed-using-r/
https://freshbiostats.wordpress.com/2013/12/03/analysis-of-pubmed-search-results-using-r/
Lots to think about.
There is also a package called scholar which gets some citation data from Google....
Tuesday, 7 July 2015
Using R to count words....
In order to analyse a piece of text to determine Elective locations from our 2015 Electives Map, I have written a script to gather the different regions of the world.
The script uses the library(stringi), particularly the function stri_count().
I have also been using lapply() and sapply().
Here is the script:
library(stringi)
setwd("/Users/paulbrennan/Documents/RforBiochemistsScripts/mapping")
data <- read.csv("electiveLocations2015V2.csv", header=T)
country <- data$country
# so this represents 68 different countries
country.count <- sapply(uniq.country, function (x) sum(stri_count(country, fixed=x)))
# set up the countries within each region
pac.is <- c("Solomon Islands", "Vanuatu", "Fiji",
"Tonga", "Samoa", "Cook Islands")
eur <- c("England", "Wales", "Scotland", "Northern Ireland",
"Switzerland", "Italy", "Malta", "Cyprus", "Denmark", "Sweden")
n.am <- c("USA", "Mexico", "Canada", "United Stated of America")
c.am <- c("Panama", "Belize", "Guatamala",
"St Vincent", "Antigua", "Britis Virgin Islands",
"Cuba", "The Bahamas", "Tobago")
s.am <- c("Brazil", "Peru", "Ecuador")
e.afr <- c("Tanzania", "Kenya", "Uganda", "Rwanda",
"Burundi", "Djibouti", "Eritrea", "Ethiopia", "Somalia",
"Comoros", "Mauritius", "Seychelles", "Réunion", "Mayotte",
"Mozambique", "Madagascar", "Malawi", "Zambia", "Zimbabwe",
"Egypt", "Sudan", "South Sudan")
se.asia <- c("Cambodia", "Malaysia", "Thailand")
# some of the countries are fine by themselves
w.afr <- c("Ghana")
s.afr <- c("South Africa")
nz <- c("New Zealand")
auz <- c("Australia")
nepal <- c("Nepal")
india <- c("India")
japan <- c("Japan")
china <- c("China")
# create a list of all the locations
locs <- list(pac.is, eur,
n.am, c.am, s.am,
w.afr, s.afr, e.afr,
nz, auz,
nepal, india, se.asia,
japan, china)
# use lapply to cycle through the whole list
# and then sapply to cycle through the items in each list.
loc.count <- lapply(locs, function (y) sum(sapply(y, function (x) sum(stri_count(country, fixed=x)))))
# this is a list of the aggregate locations (includes indiv countries sometimes)
loc.names <- c( "Pacific Islands", "Europe",
"North America", "Central America", "South America",
"West Africa", "South Africa", "East Africa",
"New Zealand", "Australia",
"Nepal", "India", "South East Asia",
"Japan", "China")
# create a data.frame - requires changing from a List unlist()
elec.tot.2015 <- as.data.frame(loc.names)
elec.tot.2015$count <- unlist(loc.count) # need to unlist the loc.count
# calculate radius, smallest value = 1
# area of a circle pi.r^2 - give area = 1, sqrt(1/pi)
# add to the data.frame
elec.tot.2015$radius <- sqrt(elec.tot.2015$count/pi)
# list of positions put into batch geocoder
# http://www.findlatitudeandlongitude.com/batch-geocode/
# paste into object called pos
pos <- read.delim(pipe("pbpaste"), header=T)
elec.tot.2015 <- merge(elec.tot.2015, pos, by.x = "loc.names", by.y = "original.address")
# write the data.frame as a tsv
setwd("/Users/paulbrennan/Dropbox/Public")
write.table(elec.tot.2015, file = "electivestotal2015.tsv", sep = "\t")
I ended up opening this in Excel, deleting the column of row numbers and changing the suffix to .txt
Tuesday, 30 June 2015
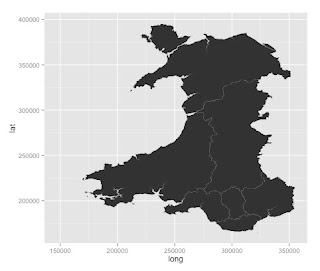
Geomapping Wales....
There is lots of data available for Wales through a variety of sources.
With the help of a few visiting students, I am trying to work out how to do some geomapping for Wales in R.
These are usually in a digital vector format.
The Office for National Statistics has some available here:
https://geoportal.statistics.gov.uk/geoportal/catalog/search/browse/browse.page
Browse the catalogue and look at "digital boundaries".
There are local boundaries of various levels.
A useful one is the map of boundaries of Local Health Boards in Wales. This was last updated in 2014. It's available here: https://geoportal.statistics.gov.uk/Docs/Boundaries/Local_health_boards_(Wal)_2014_Boundaries_(Generalised_Clipped).zip
The zip file need to be downloaded and placed in a sensible folder. The format of these files is a ESRI shapefile. This can be imported into R.
Lots of health data is gathered and delivered according to Local Health Board. This only divides Wales into 7 regions and they vary by population and many other ways.
The boundaries in the UK are divided into various levels:
With the help of a few visiting students, I am trying to work out how to do some geomapping for Wales in R.
Find some maps of Wales
First I have to find a source of some maps.These are usually in a digital vector format.
The Office for National Statistics has some available here:
https://geoportal.statistics.gov.uk/geoportal/catalog/search/browse/browse.page
Browse the catalogue and look at "digital boundaries".
There are local boundaries of various levels.
A useful one is the map of boundaries of Local Health Boards in Wales. This was last updated in 2014. It's available here: https://geoportal.statistics.gov.uk/Docs/Boundaries/Local_health_boards_(Wal)_2014_Boundaries_(Generalised_Clipped).zip
The zip file need to be downloaded and placed in a sensible folder. The format of these files is a ESRI shapefile. This can be imported into R.
Lots of health data is gathered and delivered according to Local Health Board. This only divides Wales into 7 regions and they vary by population and many other ways.
Getting the data in to R
I have found two ways so far:
- using the readOGR() function from the library(rgdal)
- using the readShapeSpatial() function from the library(maptools)
Plotting the data


Boundaries in the UK
The boundaries in the UK are divided into various levels:
- Output areas - these are the smallest regions and over 181,000 cover the UK
- Lower Layer Super Output Areas (LSOAs) - approx 35,000 cover the UK
- Middle Super Output Areas (MSOAs) - approx 7,000 cover the UK.
- Upper Super Output Areas (USOAs) - these are used in Wales but not widely in the UK.
To draw these (except it seems the USOAs), it's possible to download the maps from the geoportal mentioned above.
There is still LOTS to learn about this.
How do I really add data to this?
Here are some resources:
- http://blog.revolutionanalytics.com/2009/11/choropleth-map-r-challenge.html
- http://www.r-bloggers.com/mucking-around-with-maps-schools-and-ethnicity-in-nz/
- http://www.r-bloggers.com/maps-with-r-and-polygon-boundaries/
- http://zevross.com/blog/2014/07/16/mapping-in-r-using-the-ggplot2-package/
- http://prabhasp.com/wp/how-to-make-choropleths-in-r/
- http://stackoverflow.com/questions/24136868/plot-map-with-values-for-countries-as-color-in-r
- http://stackoverflow.com/questions/21093399/how-to-turn-gpclibpermit-to-true
- http://stackoverflow.com/questions/20309883/filling-polygons-of-a-map-using-ggplot-in-r
- http://stackoverflow.com/questions/24284356/convert-spatialpointsdataframe-to-spatiallinesdataframe-in-r
- http://cran.r-project.org/web/packages/gdata/vignettes/mapLevels.pdf
- http://www.inside-r.org/packages/cran/rgdal/docs/ogrInfo
- http://cran.r-project.org/web/packages/rgdal/rgdal.pdf
- https://www.nceas.ucsb.edu/scicomp/usecases/ReadWriteESRIShapeFiles
- http://www.r-bloggers.com/using-r-to-produce-scalable-vector-graphics-for-the-web/
- http://cran.r-project.org/web/packages/GEOmap/vignettes/GEOmap.pdf
Data sources:
- http://www.neighbourhood.statistics.gov.uk/HTMLDocs/dvc130/index.html
- https://www.healthmapswales.wales.nhs.uk/IAS/
- http://census.ukdataservice.ac.uk/get-data/related/deprivation
Draw a simple map
It's all shown here: https://www.students.ncl.ac.uk/keith.newman/r/maps-in-r
library(maps) # Provides functions that let us plot the maps library(mapdata) # Contains the hi-resolution points that mark out the countries.
# draw a world map
map('worldHires')
# nice map of Great Britian and Northern Ireland
map('worldHires', c('UK', 'Ireland', 'Isle of Man','Isle of Wight'), xlim=c(-11,3), ylim=c(49,60.9))
Monday, 22 June 2015
Interesting links...
http://stackoverflow.com/questions/14441729/read-a-csv-from-github-into-r
http://stackoverflow.com/questions/3979240/r-plotting-a-3d-surface-from-x-y-z
http://cran.r-project.org/web/packages/nlstools/nlstools.pdf
http://www.nuff.ox.ac.uk/users/hendry/
http://stackoverflow.com/questions/3979240/r-plotting-a-3d-surface-from-x-y-z
http://cran.r-project.org/web/packages/nlstools/nlstools.pdf
Sir David F. Hendry, Kt |
| Director, Program in Economic Modeling, Institute for New Economic Thinking at the Oxford Martin School. |
Friday, 19 June 2015
clustering with p-values...
This R package looks interesting:
pvclust
An R package for hierarchical clustering with p-values
Ryota Suzuki(a) and Hidetoshi Shimodaira(b)
Bootstrapping provides a method for sampling and generating the p-values.
Some information about that here:
http://www.r-bloggers.com/the-cluster-bootstrap/
pvclust
An R package for hierarchical clustering with p-values
Ryota Suzuki(a) and Hidetoshi Shimodaira(b)
Bootstrapping provides a method for sampling and generating the p-values.
Some information about that here:
http://www.r-bloggers.com/the-cluster-bootstrap/
Wednesday, 17 June 2015
form Mark Kelson
Hi Paul,
Here is some R resource that mey be interesting to a clinical trials person.
lme4 package: this fits various hierarchical models
mice package: this has functions for doing loads of things around multiple imputation (a common and preferred method for handling missing data in trials)
pwr package: lots of functions for power calculations
survival package: fits survival analysis
Fun ones
vioplot package: a package I saw recently that fits violin plots to data which I quite like
wesanderson package: a package that provides colour palettes for graphing based on the predominent colours in various Wes Anderson movies
I also attach a document that covers regulatory compliance and validation issues in clinical trials settings for R.
Hope this helps
Mark
Analysis for high content microscopy AND importing multiple files.
This StackOverload answer:
http://stackoverflow.com/questions/11433432/importing-multiple-csv-files-into-r
So idea of a workflow:
I have 10 files, all from different cells.
Contain approx 4000 points
Each file has:
position (x,y,z); distance to other protein; which node it's linked to; number of voxels
I have multiple files for each experimental condition...
Plan:
Import all the files.
Aggregate data from the imported data (rowbind, probably)
Now have 40,000 points
I have this from two experimental conditions.
Now I want to compare them!
Does treatment change the mean voxel size?
Does treatment change the mean distance?
Is there a relationship between voxel size and number of neighbours?
Is there a relationship between voxel size and the distance?
Q: the mean distance should be the same between the two data sets (HA to FLAG vs FLAG TO HA)
WE CAN CHECK THIS!
Kind of questions that might be interesting:
I guess you could say I'm interested both in trying to ask more from the data I have here (are certain distances over/under represented, are there associations between voxel size and number of neighbors, etc)
What is the pattern/distribution of distances?
Can we describe it mathematically?
What is the pattern/distribution of voxel sizes?
Can we describe it mathematically?
Tuesday, 16 June 2015
Friday, 12 June 2015
Some concepts that merit attention following conversation with Pete.
In non-linear systems, parameters may not be independent. Therefore, great care has to be given to the concept of parameter confidence intervals. It may be better to consider a confidence interval.
These can be calculated using bootstrapping, perhaps.
The nls tools package may be useful to understand and appreciate this.
Robustness test...
Run your data with 90% of the data, randomly selected.
If your values change dram
Concept 3
Testing down.
Put all the variables in and take them out one at a time.
Inspired by David F Hendry.
Predicting values from a line and making more complicated lines...
Use the function predict()
predict(results, newdata= data.frame(Area=20), se.fit=TRUE, interval = "confidence")
You can just add variables to the linear model. For example:
results <- lm(data=data, log(Tonn.Hect)~log(Area) + Age + factor(HarvestMoon))
predict(results, newdata= data.frame(Area=20), se.fit=TRUE, interval = "confidence")
You can just add variables to the linear model. For example:
results <- lm(data=data, log(Tonn.Hect)~log(Area) + Age + factor(HarvestMoon))
Copy data from your clipboard...
# for getting it into a PC!
# data=read.delim("clipboard", header=TRUE) # DON'T USE ON MAC!!
# For getting it into a mac!
data <- read.delim(pipe("pbpaste"), header=T)
Mac one from here: http://marcoghislanzoni.com/blog/2013/10/27/import-data-r-mac-os-x-clipboard/
# data=read.delim("clipboard", header=TRUE) # DON'T USE ON MAC!!
# For getting it into a mac!
data <- read.delim(pipe("pbpaste"), header=T)
Mac one from here: http://marcoghislanzoni.com/blog/2013/10/27/import-data-r-mac-os-x-clipboard/
Wednesday, 10 June 2015
Confidence intervals...
This link looks useful for help about calculating confidence intervals:
http://connectmv.com/tutorials/r-tutorial/extracting-information-from-a-linear-model-in-r/
http://connectmv.com/tutorials/r-tutorial/extracting-information-from-a-linear-model-in-r/
Another way of comparing models (Akaike's ‘An Information Criterion’)
Suggestion from @romunov
Here is a link to the information: https://stat.ethz.ch/R-manual/R-devel/library/stats/html/AIC.html
Here is a link to the information: https://stat.ethz.ch/R-manual/R-devel/library/stats/html/AIC.html
Tuesday, 9 June 2015
Using R to calculate p-values from F-statistic...
I have an F-ratio and I want to know the corresponding p-values.
I need to know the degrees of freedom for the two values used to calculate the F-ratio.
The function pf() is the one to use.
Here is an example:
pf(161.45, df1=1, df2=1, log.p = TRUE)
so the F ratio is 161.45, df1 and df2 is degrees of freedom for the two values.
Returns: -0.05129291
Here is another example:
pf(2.98, 10, 10, log.p = TRUE)
Returns: -0.05120075
Useful information here too: http://www.r-tutor.com/elementary-statistics/probability-distributions/f-distribution
I need to know the degrees of freedom for the two values used to calculate the F-ratio.
The function pf() is the one to use.
Here is an example:
pf(161.45, df1=1, df2=1, log.p = TRUE)
so the F ratio is 161.45, df1 and df2 is degrees of freedom for the two values.
Returns: -0.05129291
Here is another example:
pf(2.98, 10, 10, log.p = TRUE)
Useful information here too: http://www.r-tutor.com/elementary-statistics/probability-distributions/f-distribution
Monday, 8 June 2015
Useful links for today...
How to add text to ggplot...
http://www.sthda.com/english/wiki/ggplot2-texts-add-text-annotations-to-a-graph-in-r-software
remove NAs from a data frame
http://stackoverflow.com/questions/4862178/remove-rows-with-nas-in-data-frame
http://www.sthda.com/english/wiki/ggplot2-texts-add-text-annotations-to-a-graph-in-r-software
remove NAs from a data frame
http://stackoverflow.com/questions/4862178/remove-rows-with-nas-in-data-frame
Removing NA from a vector....
NAs cause problems.
Here's how to get rid of them from a vector....
from:
http://stackoverflow.com/questions/7706876/r-script-removing-na-values-from-a-vector
Here's how to get rid of them from a vector....
d <- d[!is.na(d)]from:
http://stackoverflow.com/questions/7706876/r-script-removing-na-values-from-a-vector
Friday, 5 June 2015
Putting line breaks into x-axis titles..
This would seem to work!
from here:
http://www.r-bloggers.com/line-breaks-between-words-in-axis-labels-in-ggplot-in-r/
Very useful!!
levels(birds$effect) <- gsub(" ", "\n", levels(birds$effect))
ggplot(birds,
aes(x = effect,
y = speed)) +
geom_boxplot()
from here:
http://www.r-bloggers.com/line-breaks-between-words-in-axis-labels-in-ggplot-in-r/
Very useful!!
levels(birds$effect) <- gsub(" ", "\n", levels(birds$effect))
ggplot(birds,
aes(x = effect,
y = speed)) +
geom_boxplot()
Playing with fonts
OK, so I couldn't download the xkcd font through R on my mac.
I had to download the font by going to the webpage and then I could install it on the mac.
Then,
font_import(pattern = "[X/x]kcd", prompt=FALSE)
fonts() #shows fonts available in R.
worked.
This is good.
script:
library(extrafont)
font_import(pattern = "[X/x]kcd", prompt=FALSE)
fonts() #shows fonts available in R.
# Type font examples
plot(1:10,1:10,type="n")
text(3,3,"Hello World Default")
text(4,4,family="Arial Black","Hello World from Arial Black")
text(5,5,family="xkcd","Hello World from xkcd")
text(6,6,family="Times New Roman","Hello World from Times New Roman")
Gives this output:
 Help from:
http://blog.revolutionanalytics.com/2012/09/how-to-use-your-favorite-fonts-in-r-charts.html
http://stackoverflow.com/questions/12675147/how-can-we-make-xkcd-style-graphs-in-r
http://www.r-bloggers.com/change-fonts-in-ggplot2-and-create-xkcd-style-graphs/
http://xkcdsucks.blogspot.co.uk/2009/03/xkcdsucks-is-proud-to-present-humor.html
http://www.r-bloggers.com/using-r-barplot-with-ggplot2/
I had to download the font by going to the webpage and then I could install it on the mac.
Then,
font_import(pattern = "[X/x]kcd", prompt=FALSE)
fonts() #shows fonts available in R.
worked.
This is good.
script:
library(extrafont)
font_import(pattern = "[X/x]kcd", prompt=FALSE)
fonts() #shows fonts available in R.
font_import() #imports lots of fonts including those below.
plot(1:10,1:10,type="n")
text(3,3,"Hello World Default")
text(4,4,family="Arial Black","Hello World from Arial Black")
text(5,5,family="xkcd","Hello World from xkcd")
text(6,6,family="Times New Roman","Hello World from Times New Roman")
Gives this output:

http://blog.revolutionanalytics.com/2012/09/how-to-use-your-favorite-fonts-in-r-charts.html
http://stackoverflow.com/questions/12675147/how-can-we-make-xkcd-style-graphs-in-r
http://www.r-bloggers.com/change-fonts-in-ggplot2-and-create-xkcd-style-graphs/
http://xkcdsucks.blogspot.co.uk/2009/03/xkcdsucks-is-proud-to-present-humor.html
http://www.r-bloggers.com/using-r-barplot-with-ggplot2/
Thursday, 21 May 2015
More about Venn Diagrams...
Package ‘VennDiagram’
This will draw a Venn Diagram if you know the numbers you want to put into each part of the diagram. It makes nice Venn Diagrams.
Venn Diagrams with the Package 'gplots'
This will calculate a Venn Diagram from lists. For a simple two list comparison, it's not really necessary.
These functions for comparing lists are sufficient:
- intersect()
- setdiff(listMCP, listJPR) # in 1st list NOT 2nd
- unique(c(listMCP,listJPR)) # combined list of both
Plotting maps in R
I found these useful blog posts that contain some interesting data:
Blank maps:
Adding data:
Third article here:
Tuesday, 5 May 2015
Setting up R for Biochemists on Github.
Step 1: Log into github - not necessary!
Step 2: set up a repository – called R for Biochemists.
Mistake – should have set it up through Github on Mac
Step 3: put all the published scripts into a folder – where?
Currently
on Dropbox
Github
doesn’t like this.
Move to
hard-drive.
Step 4 - delete the repository I set up in Step 2 - Duh :-(
Use Github for Mac to do it all.
Create repository in Github for Mac
Identify folder in Github for Mac and sync.
Subscribe to:
Comments (Atom)